Analytics for your padlets
Track your content’s reach, audience, and impact in real time.

Creating resources is great, but knowing their impact is even better. That's why we're introducing simple but powerful analytics for your padlets. Now you can track total views, unique visitors, and engagement time for your padlets.
See your padlet's reach
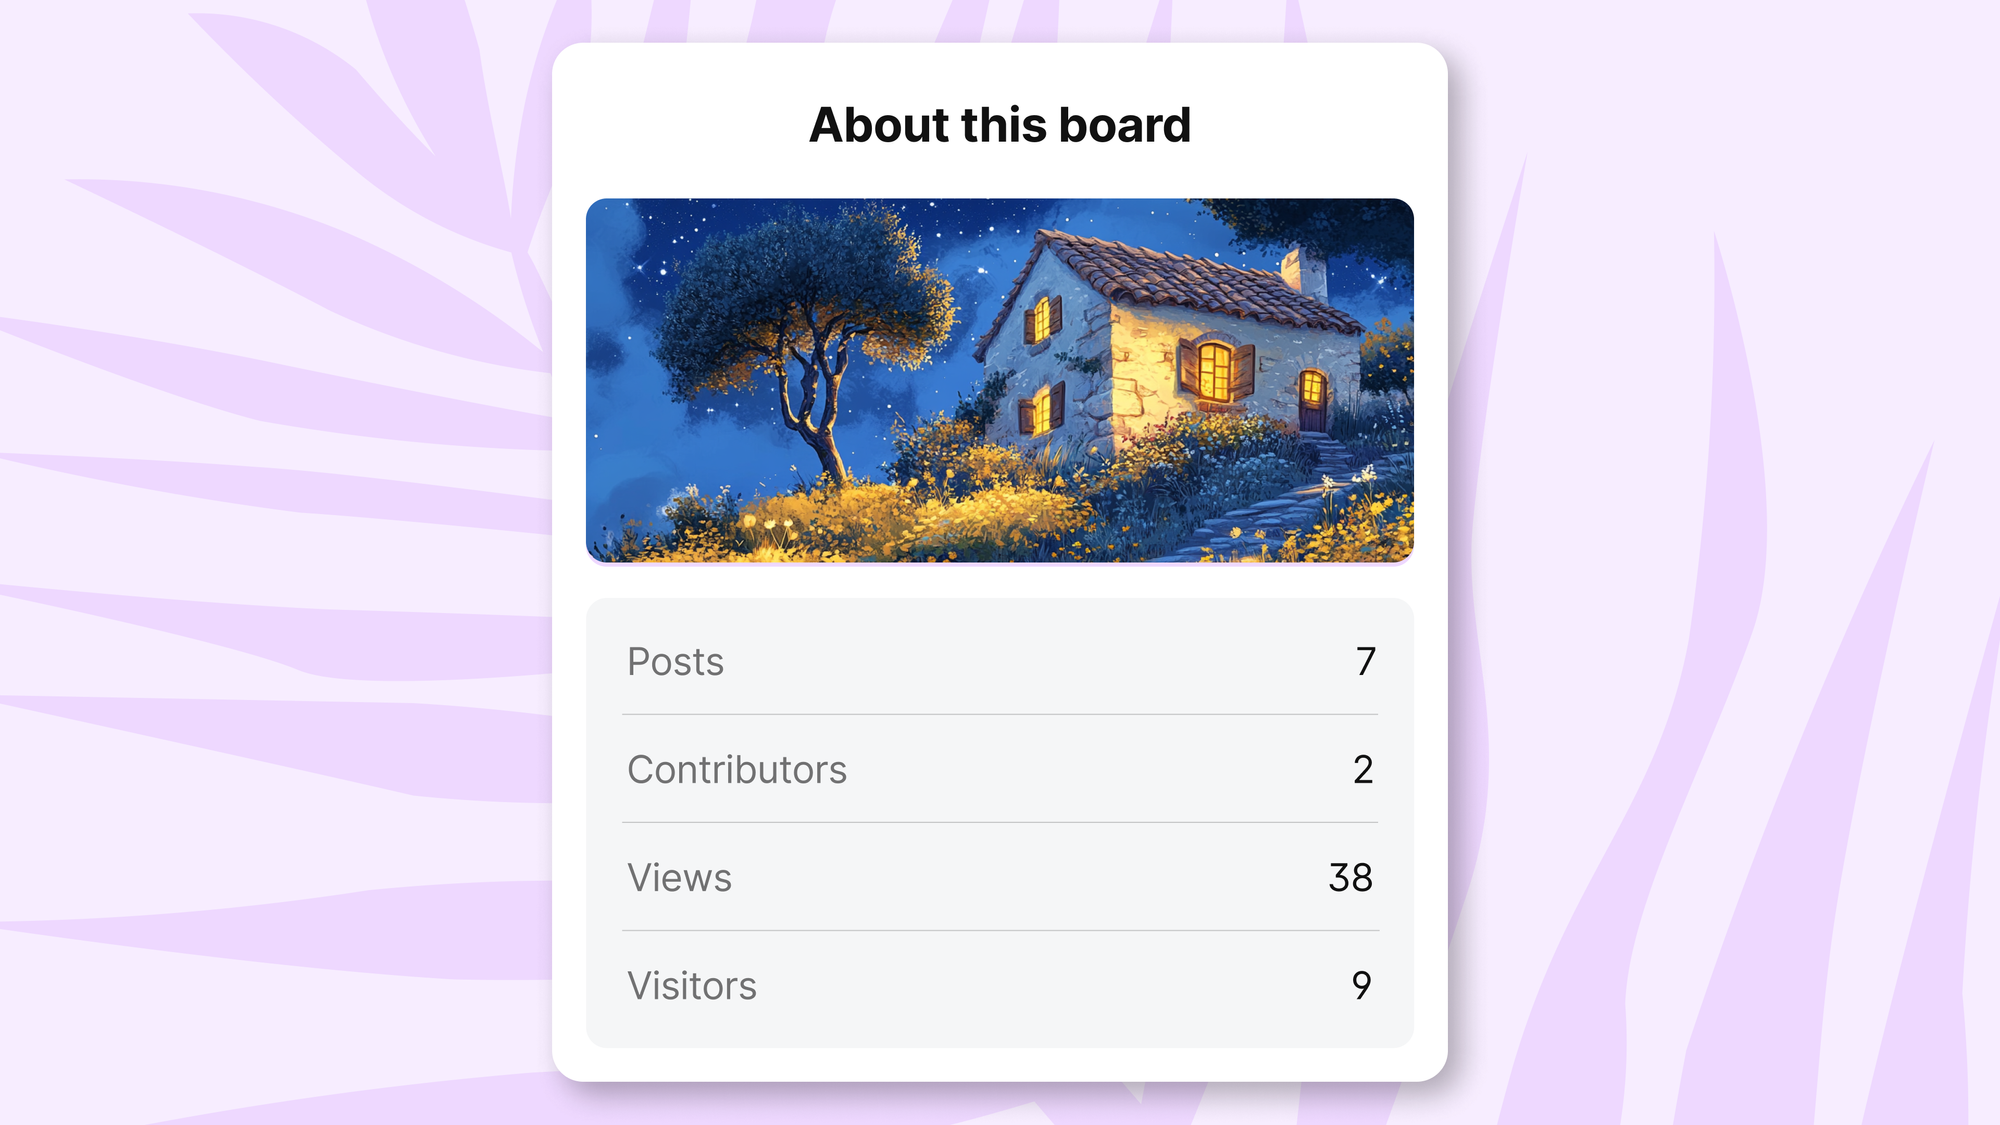
Open any board or sandbox, click the three dots in the action bar, and select "Details." At the bottom, you'll find your padlet's analytics: total views, unique visitors, and engagement time. The data updates roughly every minute to give you a current picture of your padlet's impact.

What these numbers mean
Views show how many times your padlet has been visited, while visitors tell you how many unique visitors have viewed your content. Engagement time will show how much time everyone has spent looking at your padlet.
So, if you've created a resource board for your class, you can see not just how many times it's been accessed but how many students have actually viewed it. We count these metrics in a privacy-friendly way without tracking individual users, giving you valuable insights while respecting privacy.
Keeping it simple
We've streamlined the analytics panel to focus on what matters most: your padlet's reach. If you need more detailed information about posts, comments, or reactions, you can export your padlet as a spreadsheet.
When can you use it?
Analytics are available now on the web and mobile versions of Padlet. Simply open any board or sandbox to check its stats.
What's next?
This is just the beginning of our analytics journey. We're working on more advanced metrics to help you better understand how your padlets are being used.
Have any analytics requests? Drop us a line!